
Page 13 - RFC Rhine-Alpine_Annual Report 2017
P. 13
RFC RHINE-ALPINE – Annual Report 2017
Performance Report 11
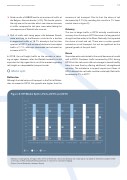
Figure 1: KPI international traffic volume
Good results of LINEAS lead to an increase of traffic at
increase of rail transport. Due to that, the share of rail decreased by 0.1% (by rounding this results in 1% lower market share in figure 2).
Antwerp
The rise in barge traffic in 2016 actually constituted a recovery from the drop in 2015 because of a long period of draught and low water in the Rhine. Naturally, this impacted the share of road and rail. There was a certain growth momentum in rail transport, but not as significant as the general growth of the port itself.
Genoa
Some elements contributed to the small decrease of modal spilt in 2016. Container traffic increased by 2.5% during
Trains
the Belgian–German border (+ 4%). This border point is
60,000
the only one on the corridor which can show an increase in traffic compared to last year, even when taking the
50,000
consequences of Rastatt into account.
40,000
Shift of traffic with heavy paper rolls between Scandi- navia and Italy to the Brenner route led to a decline
30,000
in wagonload traffic of 18.7% already in the first two quarters of 2017 and an overall decline in trans-alpine
traffic of 1.1%, although intermodal had achieved an increase of 6.7%.
10,000
In 2018, the rail freight traffic on the corridor is catch- ing up again. However0, after the Rastatt incident it is still
Aachen West Bad Bentheim, Emmerich, Venlo Modal split
Rotterdam
20,000
2008 2009 2010 2011 2012
2013 2014 2015 2016 2017
important to fully regain the trust of the market regarding rail freight as a dependable transport mode.
2016 but the rail sector did not manage to benefit swiftly
from this new flow by offering additional/strengthened
Chiasso: SSB Infra
services. The imbalance in import/export port flows of
Basel Domo, Luino, Chiasso
2016 affected the rail traffic and the modal spilt. Rail traffic
Sources: Aachen West: Infrabel, Bad Bentheim: ProRail, Emmerich: ProRail, Venlo: ProRail, Basel: SSB Infra, Domo: SSB Infra, Luino: SSB Infra,
Although the total volume of transport in the Port of Rotter- dam increased in 2016, this growth was higher than the
increased by 7% in 2017.
Figure 2: KPFiIgMuroed2a: lMSopdlaitl sipnliPt oporrtts 2015 and 2016
Percent
100
90
80
70
60
50
40
30
20
10
0
Rail Road IWW
36
36
36
38
53 54 58 56
83
Genoa 2015
84
16
Genoa 2016
11
10
76
17
Rotterdam 2015 Rotterdam 2016
Antwerp 2015
Antwerp 2016
Definition: modal split [%] of freight traffic at Port of Rotterdam, Genoa and Antwerp; the modal split is calculated for hinterland container traffic on the basis of TEUs (Twenty-Foot-Equivalent-Unit, a measure for container handling).
(Source: Port of Rotterdam, Antwerp, Genoa)
Figure 3: Modal split trans-alpine
Percent
